
Reporting and Behavior

Want to hit more of your goals? Work on your reporting.
When I was a kid, I was in Camp Fire. For those not familiar, it’s a lot like Girl Scouts/Boy Scouts: teaching principles, basic outdoor and life skills, and awarding patches. LOTS of patches.
At 12 years old, I didn’t have much interest in learning how to build a fire or erect a tent, but I did have an interest in acquiring those sweet, sweet patches to fill up my vest. As I got older and my rank increased, the patches transitioned to beads. The most successful students had hundreds of color-coded beads making a “sha-sha-sha” sound when they walked, denoting the categories in which they’d pursued achievements. And I wanted that undeniable proof of my accomplishments, the rattle of beads as I walked, likely more than I wanted the milestones themselves. Over the course of several years, I completed hundreds of challenges (and inadvertently acquired many useful skills), selecting them out of a thick book color-coded by category. Never mind that I may have selected the challenges based on which colors I needed to keep my collection of beads looking just right. Regardless, it had the intended effect: I participated with gusto and, dare I say it, joy.
I don’t want to mislead you. This wasn’t a competition. There were no pizza parties or stuffed animals. There were no trophies or catalogs of prizes. There was no ranking amongst troop members. The visual representation of the work WAS the prize. And it had 12 year-old me hooked. This is essentially gamification at its simplest level: me vs. me. And that intrinsic motivation to be measurably better than you were yesterday is one of the purest and most powerful ways to drive behavior, even in adults.
We don’t have vests with colorful patches in the business world, but we can still work with this principle to make hitting goals easier and more pleasant. Let’s look at some common business goals:
“To get our employees to fill out their timecards correctly.”
“To get things out the door on budget.”
“To sell more of the stuff we have good margins on.”
“To get customers to stick to their action plan instead of abandoning efforts partway through.”
There’s something specific all of these goals have in common: they are all behaviors that can be influenced by giving the user feedback.
That makes sense. It works organically when talking to other people. You want something to change, you give the person feedback. But that isn’t very efficient—it requires time and effort each time.
Good reporting automates feedback. It’s the vest with shiny patches of the business world.
There’s good research to back this up, though reporting can backfire if used improperly. Let’s look at what works and what doesn’t.
Public dashboards work when they’re about the task, not the person
If you’ve ever been in a class about delivering constructive feedback, whether in your personal life or at work, you’ve probably heard about the importance of describing the effect of the unwanted behavior, not characterizing the person. For example “When no one cleans up after themselves, I have to spend my whole morning tidying up the office kitchen.” is understandably more effective than “You’re an unrepentant slob and I’m grossed out by you.” The first is about the task or behavior, the second makes it about the person.
In a dashboard or business context, the difference might not be so obvious. But let’s consider a common gamification strategy.
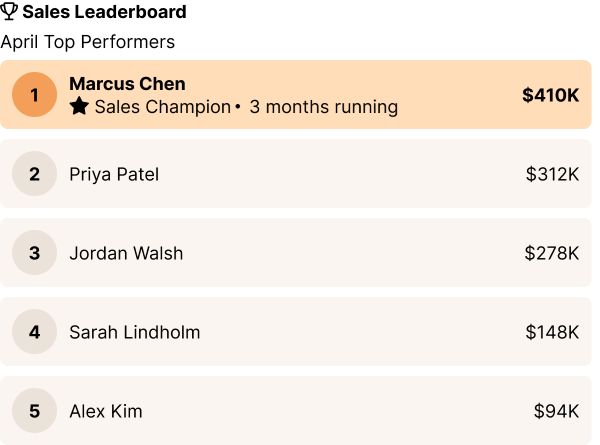
What we see in practice is that lower-performing team members tend to perform worse after introduction of a dashboard like the one below. It positions the work as competition amongst people, rather than a person vs. their goal. The badges and 1-10 rankings are doing a lot of work to make it clear who’s worthy and who isn’t. This leaves the lower performers out in the cold. No one responds well to public devaluation.
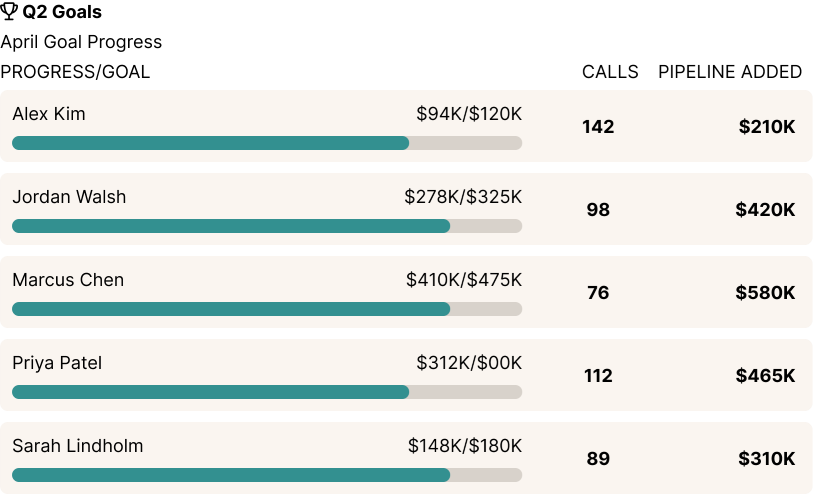
By contrast, teams perform uniformly better after the introduction of a dashboard like the one below. It shows both inputs (what the people did) and outputs. It also positions each person against their own goal, not against one another. And it shows which real actions would result in improvement.
You might also be wondering if the “me vs. me” framing means data should not be public. Actually, the research shows that much like 12 year-old me showing off my stacks of patches, public dashboards have the best results—but only if they are focused on tasks, not personal rankings.
Real-time matters
One consistent finding between top performers and lower performers is that real-time feedback matters. If feedback is instant (or as close to it as possible), the brain is more likely to focus on the actions that will improve the numbers, vs. focusing on what the numbers say about you as a person. That’s where positive behavior comes from.
But how real-time does it need to be?
If you’re working on your golf game, those simulators that give you feedback after every swing are great. Now by contrast, imagine hitting balls into a dense fog so you couldn’t see where they landed until the end of a round, when someone would tell you your total score. Not nearly as helpful, right? So why do we do so much reporting after the fact?
Mostly, this happens because leadership doesn’t see the cost. For example, we worked with a company who had been using monthly and quarterly goals. They had a manual process involving people compiling spreadsheets to provide feedback monthly. It did almost nothing, until we worked with them and broke those down into weekly goals with real-time progress feedback. Then performance suddenly shot up by about 30%. Why? Because feedback that’s too delayed from the action that caused it is nearly useless. Imagine trying to drive a car that turned 30 seconds after you moved the wheel. Delayed feedback is great for a postmortem. But to make meaningful day-to-day progress, you want fast feedback.
But what about when real-time isn’t realistic? If you’re feeding data into a data lake or warehouse, there are benefits to avoiding a performance hit on the live system. And that may be important. But there’s some nuance based on the type of behavior you’re hoping to drive and what you’re using the reports for.
Very broadly, the kinds of reporting and dashboards we’re talking about to drive individual behavior tend to be relatively simple and have a low performance hit. It’s listing one person’s activities relative to a goal. That person will benefit from real-time feedback, and since the reports being run are relatively simple, the performance hit is low. Those may be able to run directly on the live database in many cases.
By contrast, management reports tend to cover the bigger picture and be more intensive in terms of their effect on performance. For some clients, it makes sense to separate these out and run them from a reporting database since the real-time effects aren’t as strong, and the performance hit is greater.
Leave room for experimentation
While measuring inputs is good and keeps the focus on the task, it can also discourage innovation. Make sure what you’re measuring leaves some room for creativity. For example, in our firm, quite a bit of innovation comes from people noticing a problem that impacts them and taking a little time to experiment with a solution. For example, team members have built little productivity hacks like a CI/CD status page that wasn’t an official assignment, but was immensely useful. If we mandated adherence to a set schedule of what people worked on every hour of every day, that wouldn’t happen. At the same time, data on where our team spends their time is critical—time is a valuable and perishable asset. So we show metrics of whether people are tracking time, but don’t show metrics of how closely that matches what we expected them to be working on. We value having the data over forcing a set schedule.
This comes into some tension with the ‘measure inputs’ philosophy, because usually some variation in inputs is needed to get creative. For example, when tracking sales activities, measuring phone calls made might work well for some salespeople but be demotivating for others who prefer a more quality-based approach. To arrive at a useful metric, try thinking of what truly moves the needle. It may be somewhere between an input and an output. For example, measuring dollars worth of proposals sent is an input, but also allows for some individual variation in how you got there.
It’s also worth considering what unit you are measuring. Do you care more about the quantity of proposals sent, or the total dollar amount? Do you care more about the dollars of revenue, or the profit margin? The more closely we can align what’s measured with the outcome that makes a difference to the business, the more successful we will be.
Just like those long-ago Camp Fire challenges, if they had measured “minutes spent trying to start a fire with flint”, I could have sat there halfheartedly striking rocks for hours. But they didn’t—the patch came from starting a fire, so I worked until I got it, scabbed knuckles and all.
We may not have vests with shiny patches in the business world, but we can still start plenty of fires, given the right encouragement.